Confidence is a very important aspect of your analysis especially when we are looking at the bitcoin and crypto markets. How much confidence is there actually at the moment? Are traders and investors speculating on altcoins? The more confidence there is in a certain market, the more speculation we are seeing usually.
The most important chart to measure the confidence in the crypto markets is the Bitcoin dominance chart. Bitcoin is the most important digital currency and when we are inn uncertain times most investors want to play it safe and therefor have the majority of their portfolio in Bitcoin. Altcoins have a lower market cap than Bitcoin and therefor are more prone to volatility and in uncertain times investors and traders want to avoid taking extra risks.
So, whenever more liquidity flows into Bitcoin compared to the overall market cap of crypto the bitcoin dominance increases and whenever more liquidity from Bitcoin is flowing into altcoins the bitcoin dominance decreases. Therefor if you want to speculate on altcoins as an investor or trader it is very important to analyze the Bitcoin dominance chart.
In the following chart you can see the clear inverse correlation between the Bitcoin dominance and the value of Ethereum in the bitcoin comparative (ETH/BTC). When the orange line (Bitcoin dominance) increases so, more liquidity is flowing into Bitcoin we are seeing the blue line (Ethereum) losing value against Bitcoin.
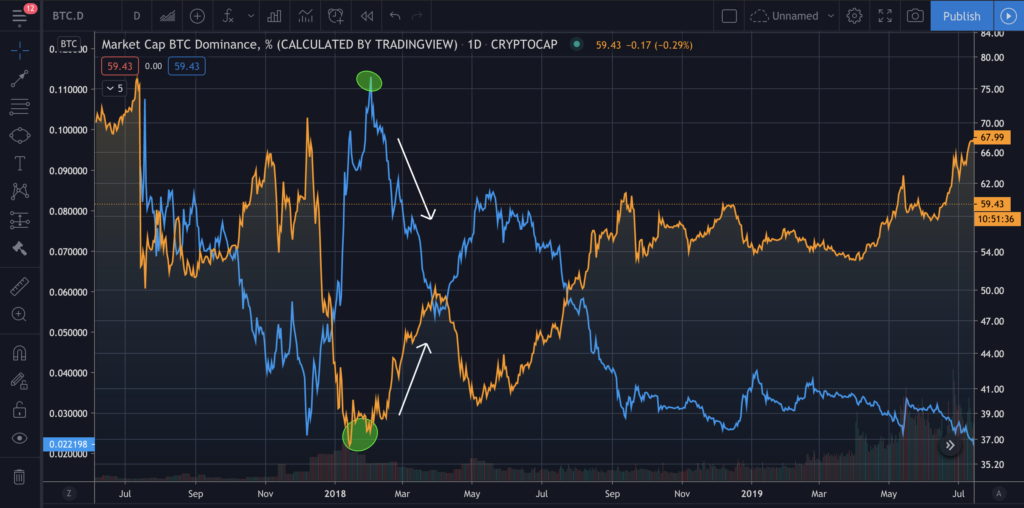
So ,whenever you are spotting weakness in the Bitcoin dominance it could potentially signal that liquidity will flow from bitcoin into altcoins. And when the Bitcoin dominance is rising, we are seeing the exact opposite, liquidity from altcoins is flowing into Bitcoin. So, the Bitcoin dominance chart is very important when analyzing altcoins but could it help us getting a better understanding in which market conditions we are? And how much confidence there is in the markets? And tell us something about the Bitcoin price?
Let’s have a look at the correlation between the crypto market cap and the Bitcoin dominance. In the following chart you see the total market cap of crypto (blue line) overlayed on the Bitcoin dominance chart (orange line).
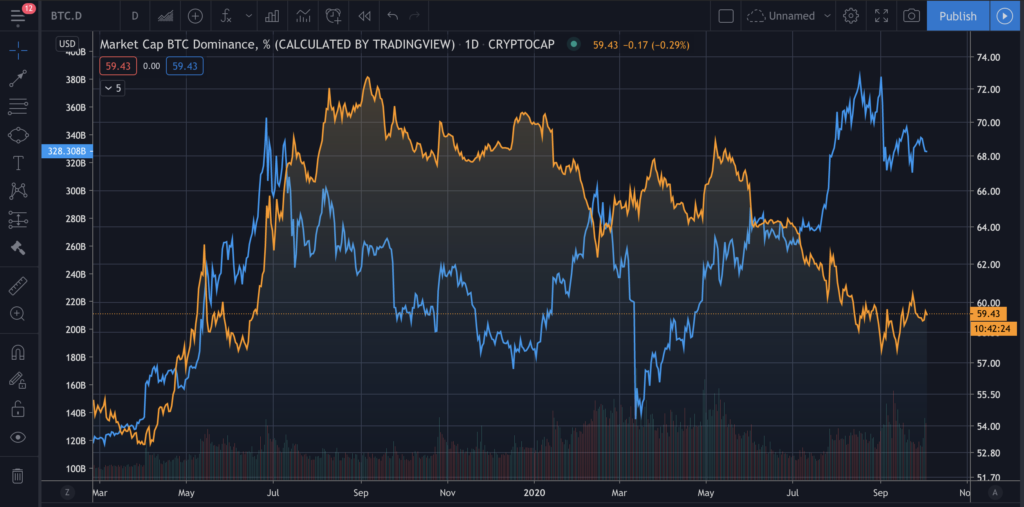
In this chart we can see a clear inverse correlation as well. Once the Bitcoin dominance increase, the total crypto market cap is decreasing, which means that liquidity is not only flowing out of altcoins into Bitcoin, but that liquidity is as well flowing out of the total crypto market cap. This is strengthening the idea of investors and traders are losing confidence and therefore not only hedge in BTC (against Altcoins) but as well in FIAT (USDT) against Bitcoin. So when the Bitcoin dominance is rising confidence is likely periodically being lost in the total crypto market.
Now let’s have a look at the step. Let’s overlay the Bitcoin/USD chart over the Bitcoin dominance. In the following chart you are seeing the Bitcoin price (blue line) overlayed on the Bitcoin dominance (orange line).
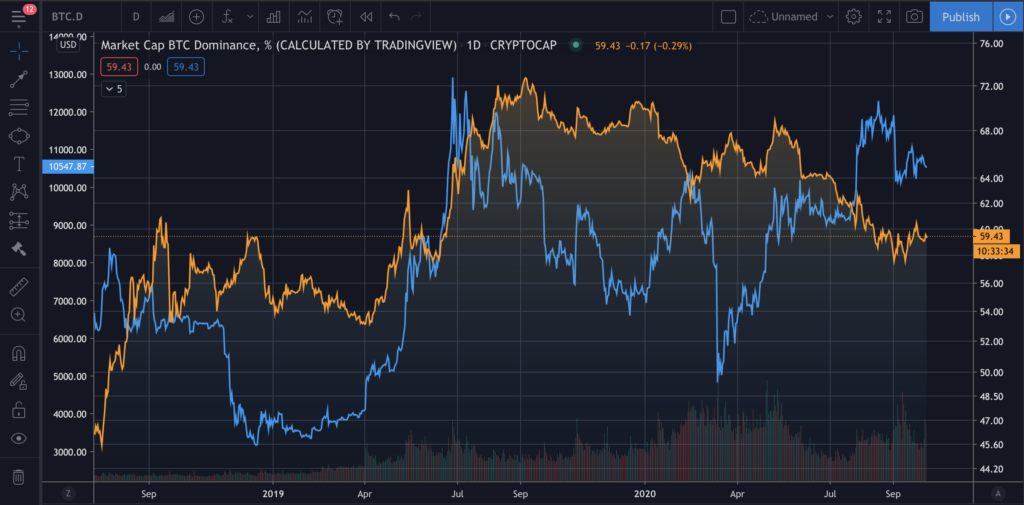
In this chart we are seeing an inverse correlation as well however it is slightly different than the previous charts. When Bitcoin made has seen a steep increase we have seen the Bitcoin dominance rise with it as well (white box) . But after Bitcoin topped out at 13.8K and the price of bitcoin was decreasing, we have seen the dominance increase as well (red box).
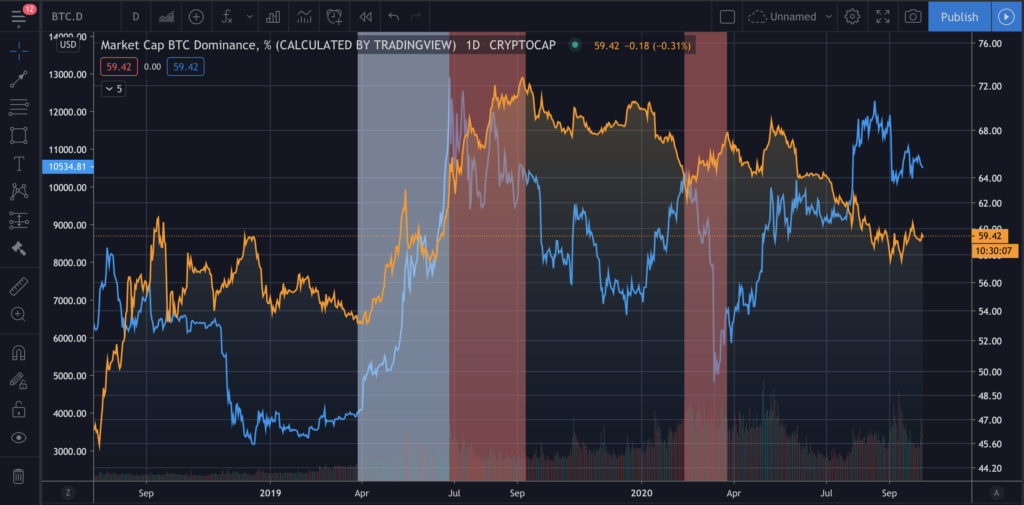
I think this is an important inverse correlation which can signal investors and traders early on about how much confidence there is within the crypto markets as a whole or solely in Bitcoin. When we are seeing that the bitcoin dominance chart is looking bullish, we need to be cautious because it could sign for a potential drop in the bitcoin price.
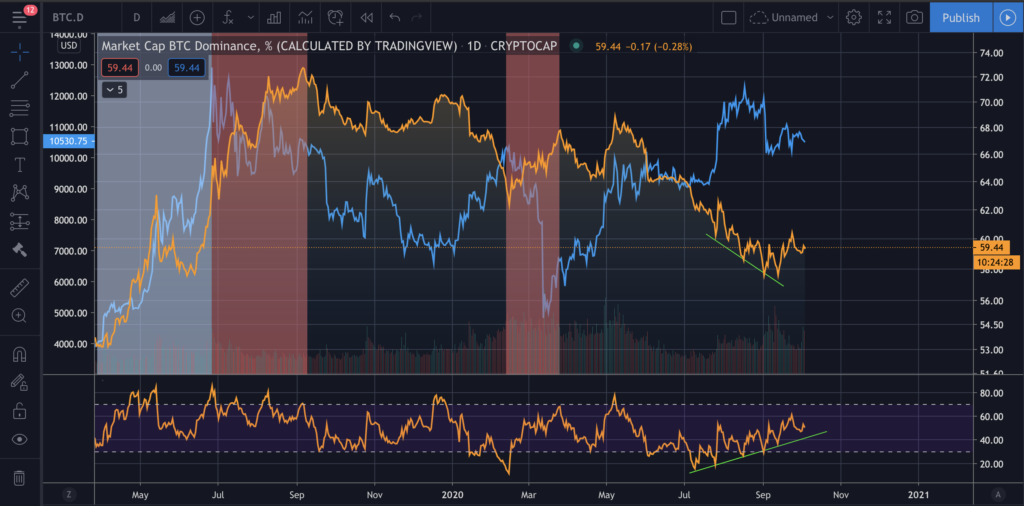
Right now, when we look at the RSI we can see a very clear divergence signalling us that the Bitcoin dominance most likely will increase in the near future. We have to prepare ourself as traders that this might signal a drop in the price of Bitcoin. There is a lot of information we can extract from this chart and use it into our analysis.
