WEEKLY
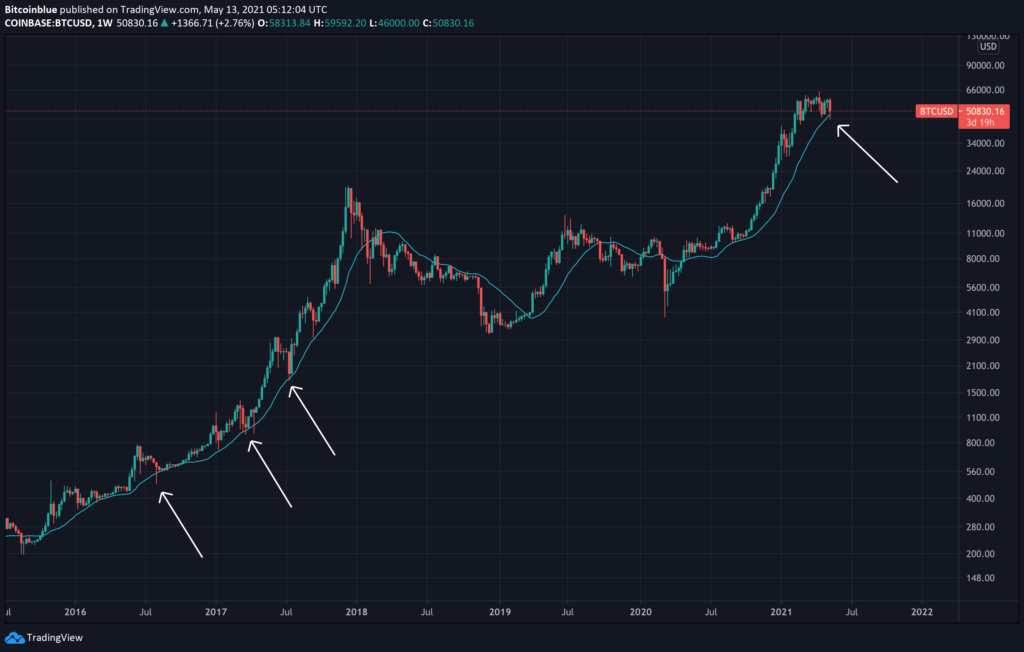
Bitcoin has seen a drop below the 20 Week Moving Average, the bull market support line. This is something we’ve seen in 2016-2017 as well. We’re ending the consolidation/corrective period with a shakeout. Moving Bitcoins from weak hands to strong hands. It might be possible we just’ve seen the shakeout and Bitcoin can prepare for the next rally.
DAILY
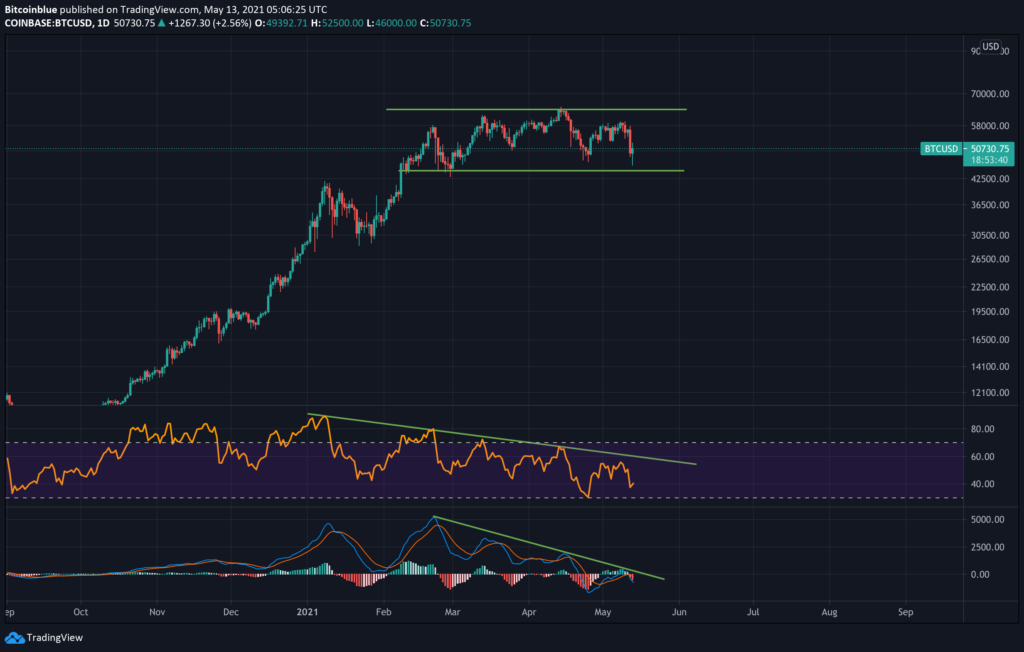
Bitcoin on the daily is still in the consolidation range (45k – 65k). If we break out of this range I expect Bitcoin to reach the next target at 80k. On the daily momentum indicators we have clear consolidation structures with a declining resistance. This can be a great sign showing use when the momentum is going to shift.
4H
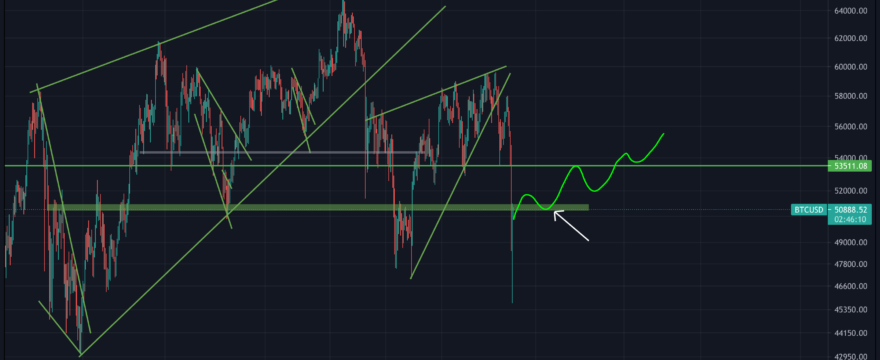
If we zoom in we can see Bitcoin is approaching a resistance level right now which could provide a good long entry opportunity at +- 50900 USD.
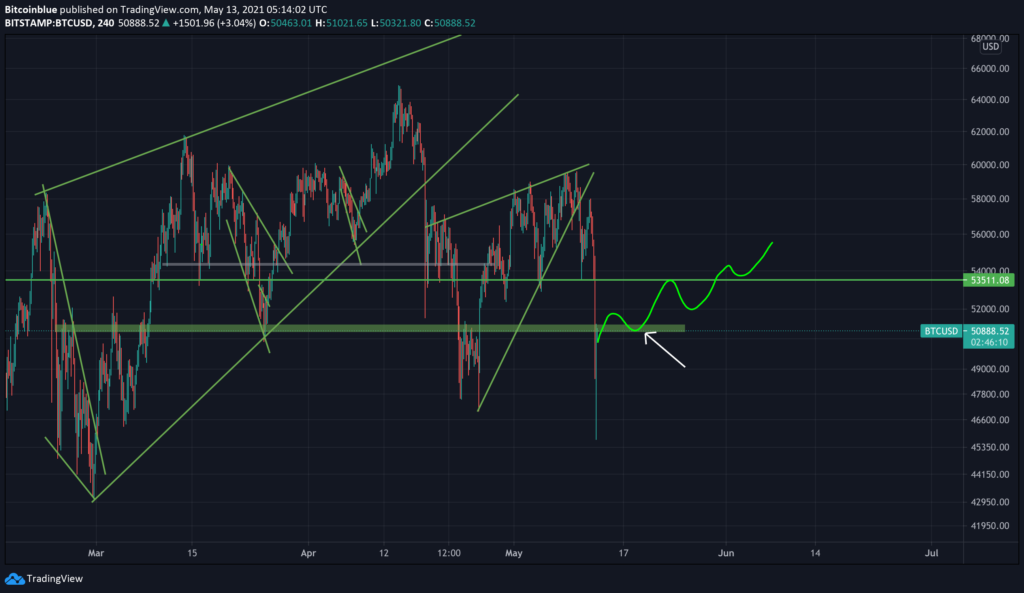
There are multiple ways to trade the Bitcoin price right now, let me break it down.
– Long Bitcoin at the moment of breakout at 50900-51000
– Long Bitcoin at the re-test of the breakout at 50900 – 51000 (Recommended)
– Long Bitcoin when momentum indicators break resistance
– Long Bitcoin when break all time high at 65K
– Long Bitcoin after confirmed bullish divergence
Invalidation : Decisive break below 50.000.
Another scenario would be that we first going to form a bullish divergence on the 1h/4h chart like we’ve seen in the recent rallies of Bitcoin as well.
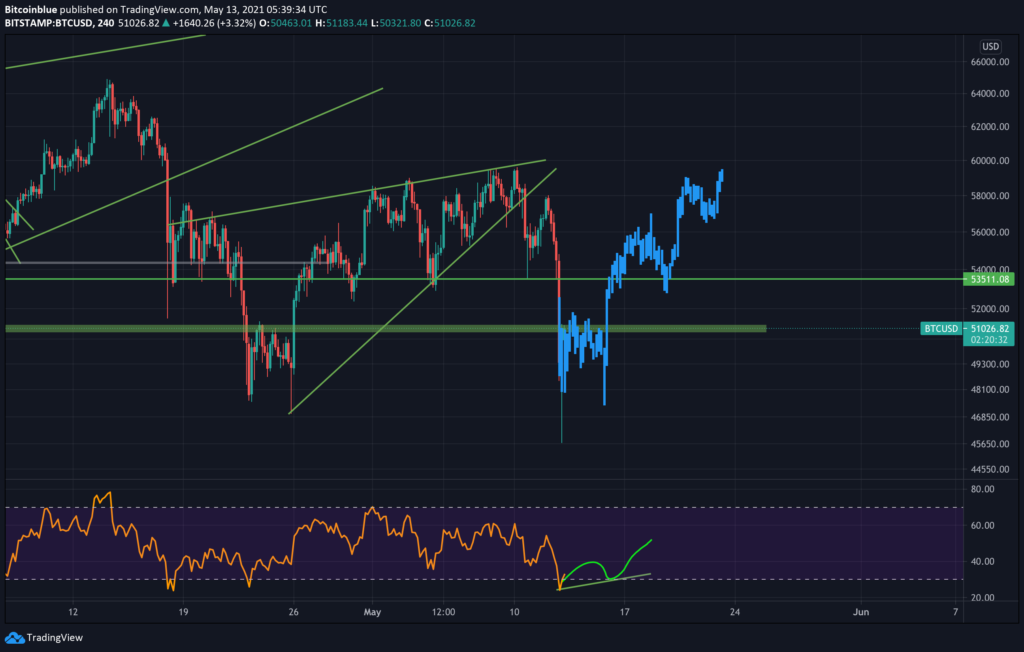
Scenario is quite similar to the other ones then. Just something to keep in mind.
